The three equations of motion will be used to create velocity-time graphs.
Case 1: Velocity-time graphs with constant velocity (zero acceleration)
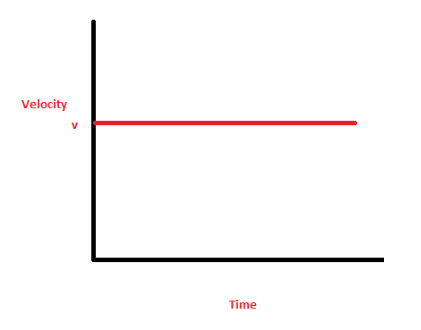
When the velocity is constant, the velocity-time graph, with Y-axis denoting velocity and the X-axis denoting time, will be like:

As the graph shows, the velocity is constant (c) throughout the interval.
No matter how much time changes, the velocity of a particle of matter will always be c. We have assumed that the initial velocity in this situation is positive.
In the event that the initial velocity is negative, the graph will be altered.
A particle’s velocity will remain constant over time if its acceleration is zero (zero) and it is always, say, 5 m/s at time zero.
Case 2: Velocity-time graphs with constant acceleration
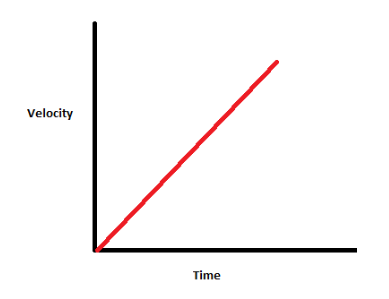
When the acceleration is constant (positive), and the initial velocity of the particle is zero, the velocity of the particle will increase linearly as predicted by the equation:
v = u + at
Since u = 0
v = at

The particle’s velocity will rise linearly with respect to time, as depicted in the figure. The amount of acceleration will be determined by the graph’s slope.
For example, if a particle’s acceleration is constant (k) and positive, its initial velocity is zero, and it then increases linearly. The acceleration will be determined by the velocity-time graph’s slope.
Case 3: Velocity-time graphs with increasing acceleration

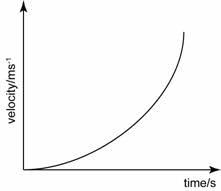
The velocity-time graph will have a curve when the acceleration is increasing over time, as predicted by
the equation v = u + at.
As v = at and u = 0,
The velocity-time graph will be a curve because acceleration is a function of time.
Note: Because the acceleration keeps getting faster over time, the slope’s magnitude will also keep getting bigger.
Example : he velocity-time graph will have a curve if the acceleration of a particle is a function of time and its initial velocity is zero. The acceleration at any point in time can be calculated from the slope of the velocity-time graph.
