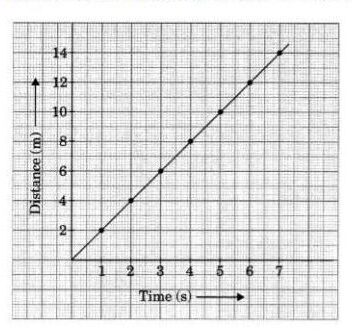
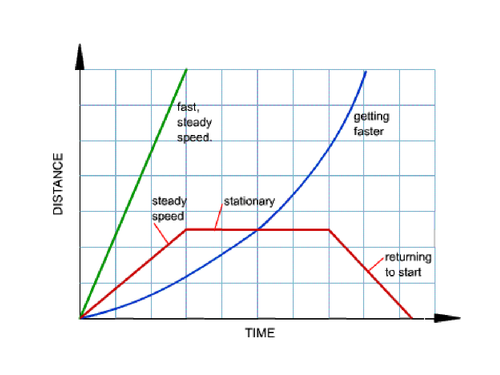
A distance-time graph shows how far an object has travelled in a given time. It is a line graph that denotes distance versus time for finding speed.
Distance is plotted on the Y-axis.
Time is plotted on the X-axis.
N.B: Curved lines on a distance-time graph represents that the speed is changing.
A Distance-Time Graph’s Importance
When analysing the motion of bodies, we work with the distance-time graph. A distance-time graph corresponding to a body’s motion can be created if we measure a body’s motion’s distance and time and plot the resulting data on a rectangular graph.

Example:
For better understanding, let us consider an example of uniform motion. A driver drives at a constant speed which is indicated by the speedometer and the driver measures the time taken for every kilometre. The driver notices that travels 1 kilometre every 2 minutes.
Graph between Distance and Time on above table data

The graph is a straight line and the motion of the bus is also uniform. Also, from the graph, we can find the speed at any instant of time. The initial and final position of the car can be found as the following:
Speed = (Final Position-Initial position ) / Time
The slope of the line can be found by drawing a rectangle any where near the straight line which determines the speed . If an object is not moving, the distance-time graph results in a horizontal line which shows that the object is at rest.

Conclusion:
The following things can be concluded now:
i) The motion is uniform if the space-time graph is a straight line.
ii) If a body’s distance-time graph is known, its speed can be determined using the graph’s slope.
iii) No matter the interval picked, the straight-line graph’s slope remains constant. This suggests that an object moving uniformly will have a constant speed.
